 Cargoo Support
Carrier KPIs
Carrier KPIs allow you to track the performance of all your carriers in the specific time period as per commodity volume (kg or TEU), delayed arrivals, time between booking request and carrier confirmation, delayed departure, original delayed departure, transit time.
To access the Carrier KPI page
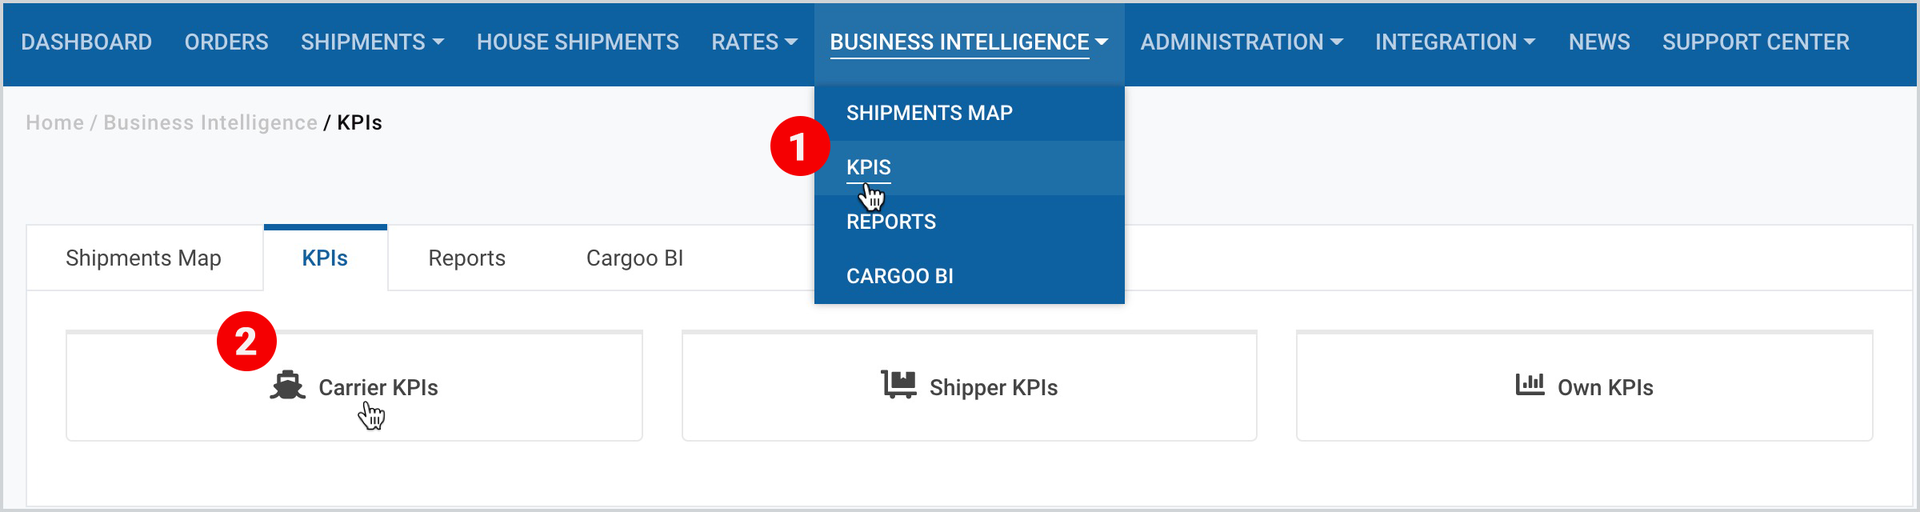
- On the Main Menu, click Business Intelligence>KPIs.
- On the left side of the page, click Carrier KPIs.
Note | The page allows you to see data for multiple companies, depending on your account accesses, the detailed explanation of which can be found in Key Performance Indicators, under the section Data for Multiple Companies. |
To filter the KPI as per particular carrier
- Take the two initial steps described here.
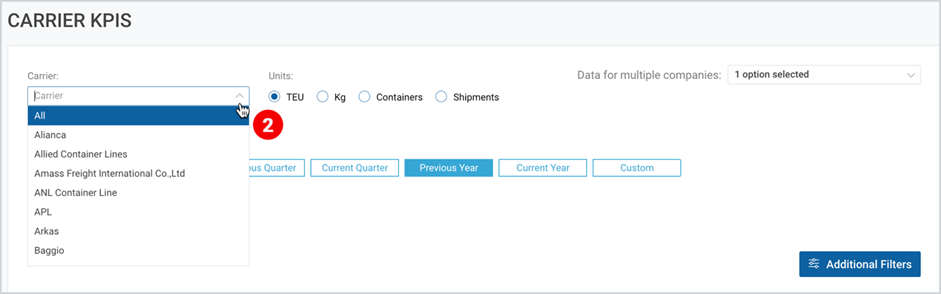
- On the left side of the page, under Carrier, click the drop-down and search or select the desired carrier (single select option).
Note | The shipments data are shown based on the selected unit (TEUs, Kg, Containers or Shipments) the details of which can be found in Key Performance Indicators, under the section Units. |
Note | The shipments data are shown based on the selected shipment window, the details of which can be found in Key Performance Indicators, under the section Shipping Window. |
Note | The page by default displays the KPI data in the chart view, which can any time be switched to table view in Flexmonster, the details of which can be found in Key Performance Indicators, under the section Chart and Table Views of KPIs. |
Volume per Carrier
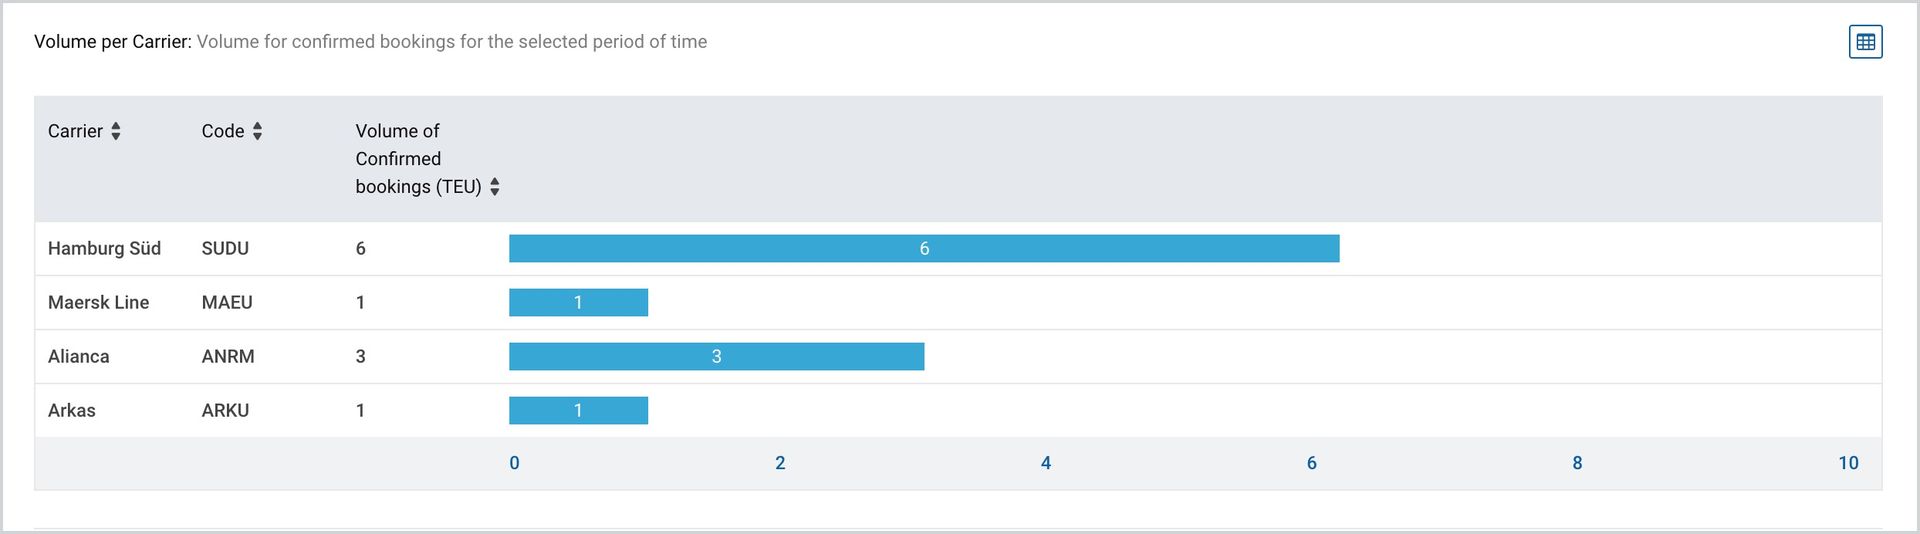
Volume per Carrier KPI shows the volume for confirmed bookings for the selected period of time. The charts show only shipments with status confirmed and higher, while rejected and cancelled shipments are excluded from them. Volume is shown for the sum of all TEUs (or KGs) of all planned containers. Volume is shown for the sum of all TEUs (or KGs, shipments, containers) of all planned bookings.
To view the chart
- Take the two initial steps described here.
- Under Additional Filters, scroll to the first chart.
The figure below shows the volume of the confirmed booking by all carriers (calculated in TEUs) with the shipping window set within the previous quarter.
Note | If TEU, KG containers and shipments are missing from the chart, then it is assumed as equal to zero. |
Delayed Arrivals
Delayed Arrivals chart shows the number of arrived shipments (TEUs, kg, containers) with a difference between latest ETA as per the latest booking confirmation and ATA. The charts show only shipments with status arrived and higher, while rejected and cancelled shipments are excluded from them. Regardless the confirmation is manual or received/updated from carrier, the ETA from latest booking confirmation compared to ATA is considered. One ETA must be selected from the following choice:
- Latest booking confirmation ETA (default)
- First booking confirmation ETA (same shipment)
- Frozen ETA
The time periods are categorized as follows:
- more or equal to 2 days [red]
- less than 2 days (but more than 0 day) [yellow]
- on-time shipments (0 days or less (early arrivals)) [green]
To view the Delayed Arrivals chart
- Take the two initial steps described here.
- Under Additional Filters, scroll to the second chart.
The figure below shows the delayed arrivals by all carriers, calculated in TEUs for the arrived shipments delay with the selection of the first booking confirmation ETA and the shipping window set within the previous month.
All categories are represented in different colors on the right side of the chart and by clicking on each of them you can visually add or omit their data.
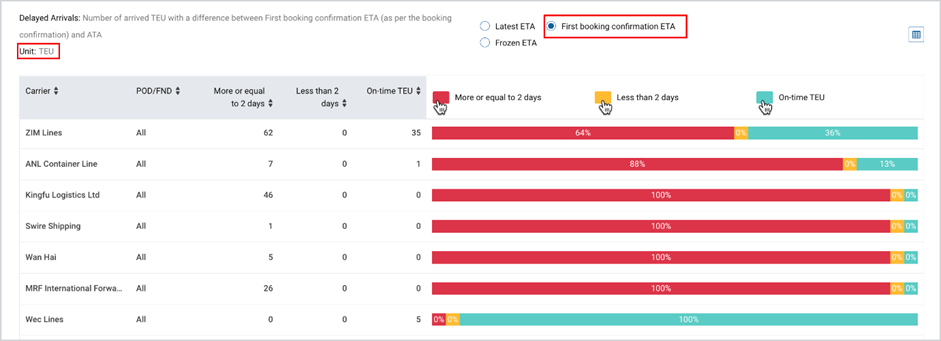
The chart by default displays the data for all POD/FNDs. You can click on the carrier’s name at the left part of the chart to expand the table of available POD/FNDs.
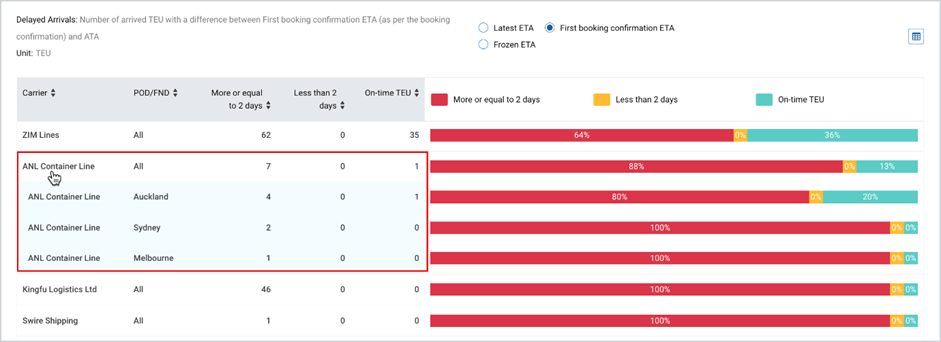
Note | When the Kg is selected in the Unit section, then as a unit, Shipment is displayed instead of Kg. The same is in the case of Delayed Departures, Original Delayed Departure and Time Between Booking Request and Carrier Confirmation charts (see the Figure below) |
Time Between Booking Request and Carrier Confirmation
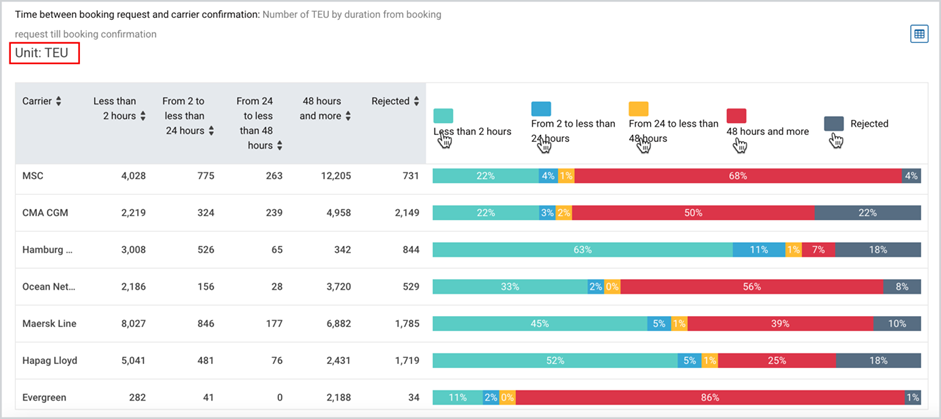
This chart shows the number of hours (including minutes and seconds) taken between the latest booking request (submission) sent and first booking confirmation received both for manual and automated booking requests/confirmation.
The time periods are categorized as follows:
- Less than 2 hours (but more than 0 days) [green]
- From 24 to less than 48 hours [blue]
- 48 hours and more [yellow]
- Rejected (rejected booking requests, more than 48 hours) [grey]
To view this chart
- Take the two initial steps described here.
- Under Additional Filters, scroll to the third chart.
The figure below shows the delays by all carriers, calculated in TEUs with the shipping window set within the previous month.
All categories are represented in different colors on the right side of the chart and by clicking on each of them you can visually add or omit their data.
Delayed Departure
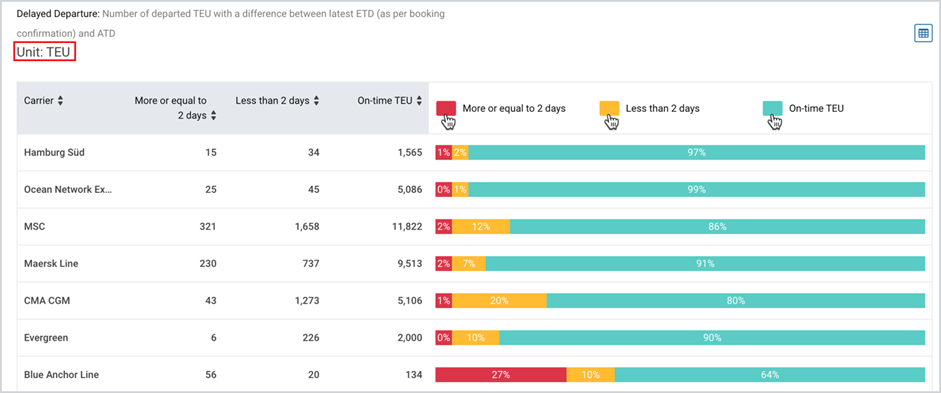
Delayed Departure shows the number of departed shipments (TEUs, kg, containers) with a difference between latest ETD as per latest booking confirmation compared to ATD. Only shipments with status shipped or higher are considered. The chart calculation does not include rejected and cancelled shipments.
The time periods are categorized as follows:
- more or equal to 2 days [red]
- less than 2 days (but more than 0 day) [yellow]
- on-time shipments (0 days or less (early departure)) [green]
To view the chart
- Take the two initial steps described here.
- Under Additional Filters, scroll to the fourth chart.
The figure below shows the delays by all carriers, calculated in TEUs with the shipping window set within the previous month.
All categories are represented in different colors on the right side of the window and by clicking on each of them you can visually add or omit their data.
Original Delayed Departure
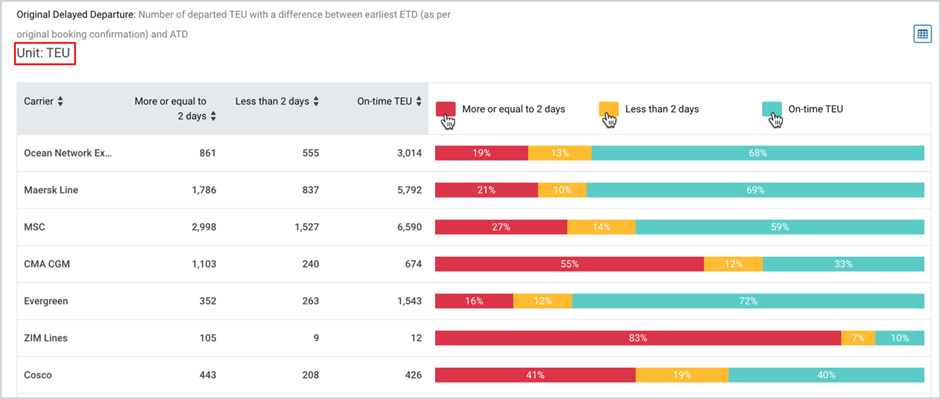
Original Delayed Departure chart shows the number of departed shipments (TEUs, kg, containers) with a difference between earliest ETD as per the initial (first) booking.
The time periods are categorized as follows:
- more or equal to 2 days [red]
- less than 2 days (but more than 0 day) [yellow]
- on-time shipments (0 days or less (early departure)) [green]
To view it
- Take the two initial steps described here.
- Under Additional Filters, scroll to the fifth chart.
The figure below shows the delays by all carriers calculated in TEUs with the shipping window set within the previous year.
All categories are represented in different colors on the right side of the window and by clicking on each of them you can visually add or omit their data.
B/L Documents Upload
B/L Documents Upload window shows the number of shipments (TEUs, kg, containers) by timeliness of uploaded Carrier Bill of Lading (Seaway) and Carrier Bill of Lading documents. The chart shows only shipments with status shipped and higher.
The time periods are categorized as follows:
- Late – the document is uploaded after 48 hours from shipment departure (ATD) [red]
- On-time - the document is uploaded within 48 hours from shipment departure (ATD) [green]
To view the chart
- Take the two initial steps, described here.
- Under Additional Filters, scroll to the sixth chart.
The figure below shows the upload of all B/L documents calculated in TEUs with the shipping window set within the previous quarter.
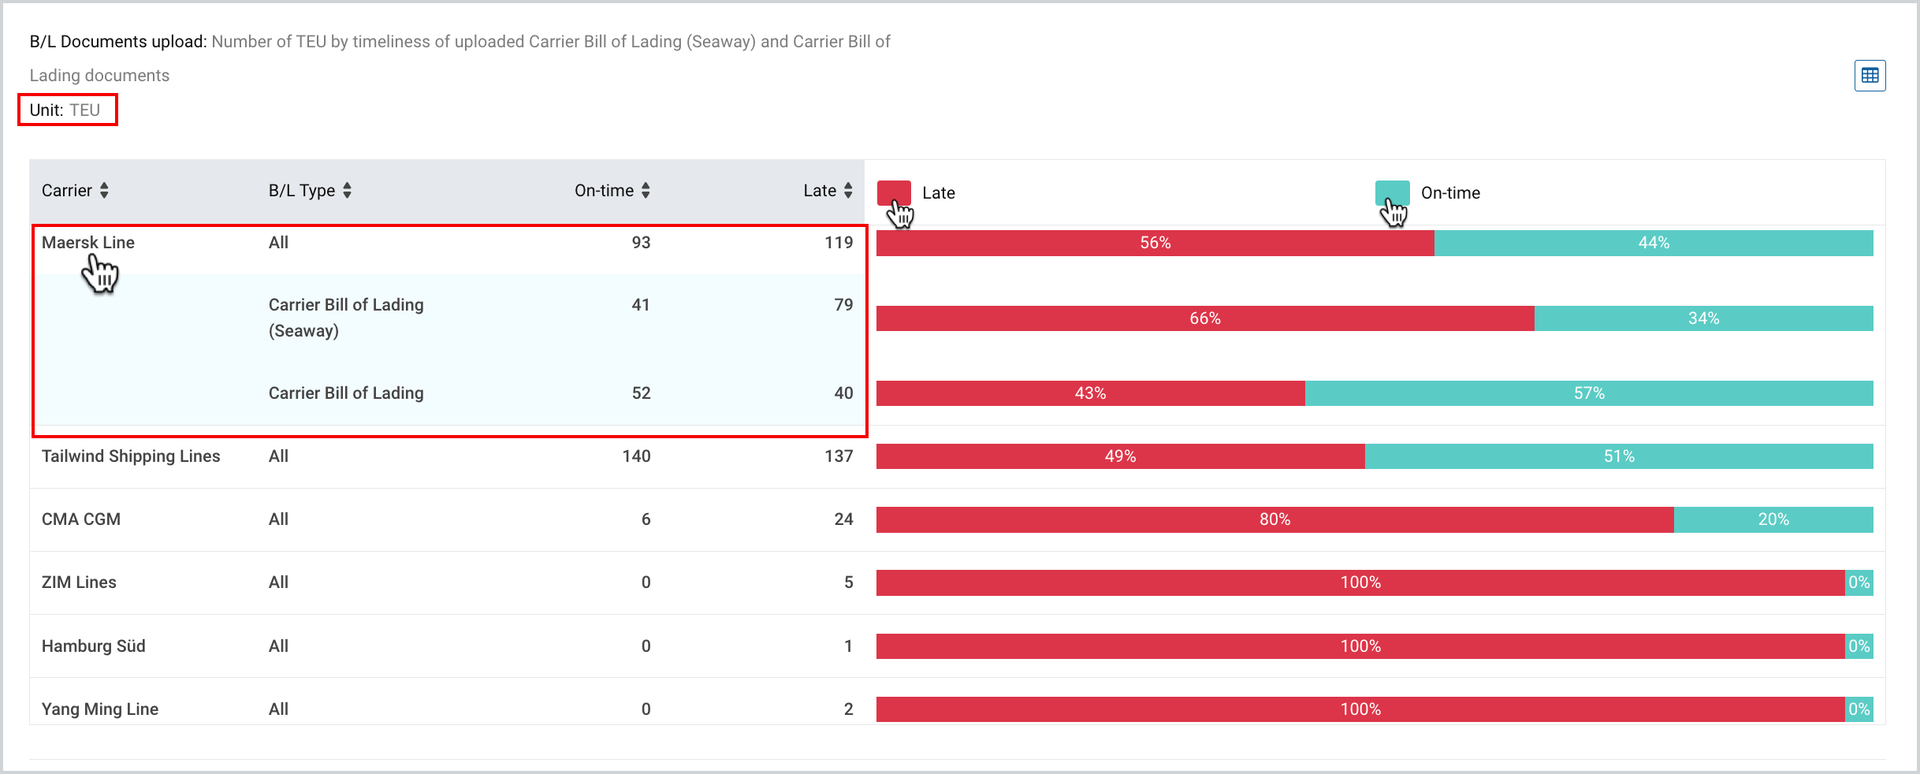
At the right side of the chart, you can visually add or omit on-time and late documents by clicking on respective color.
The chart by default displays the overall number of B/L documents. You can click on the carrier’s name at the left part of the chart to expand the table and see the number of Carrier Bill of Lading and Carrier Bill of Lading (Seaway) separately.
Note | If KG is selected as a unit, Shipments are displayed instead. |
Transit Time
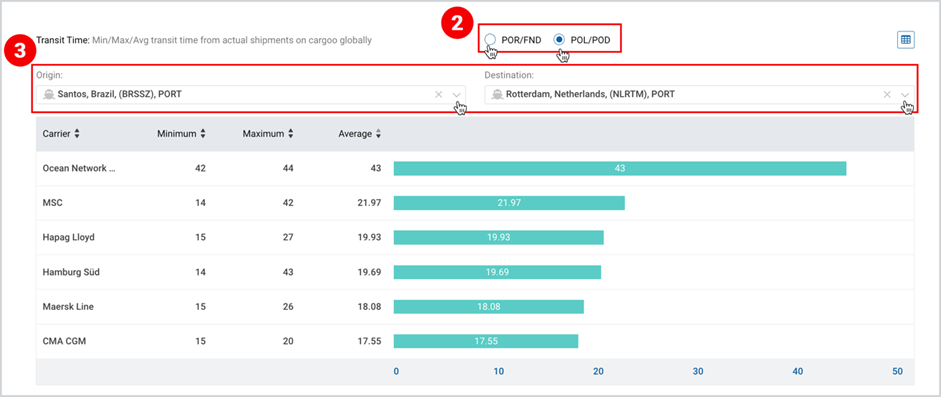
Transit time shows minimum/average/maximum number of days between ATD and ATA of all shipments in the system for the selected Origin/Destination for the carrier. Here you can specify which part of the journey should be measured:
- POR/FND - all shipments where POR and FND exactly match codes and location types specified in Origin and Destination fields. Transit time here is a sum of all legs’ transit time.
- POL/POD – all shipments where POR and FND exactly match codes and location types specified in Origin and Destination fields (default selection). Transit time here is a main carriage transit time.
Note |
|
|
To view the chart
- Take the two initial steps described here.
- Scroll to the bottom of the page and select the journey - POR/FND or POL/POD
- Click the dropdowns on the origin and destination ports and select them.
The figure below shows the transit time by all carriers with the shipping window set within the previous quarter for the selected POL/POD journey.
Export Underlying Containers of Carrier KPIs
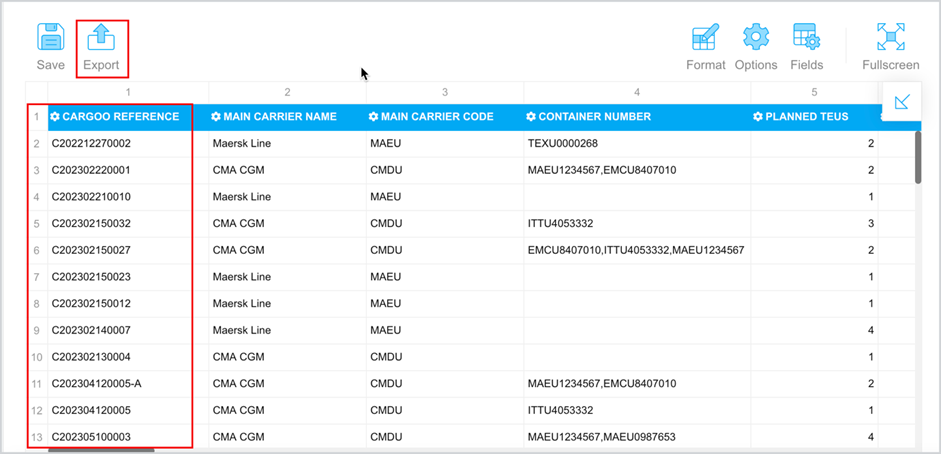
For all KPIs, you have a possibility to export underlying container details in excel/csv format. However, this information can be retrieved only in table view of the KPI.
Note | The Carrier KPIs page contains also the functionality of Additional Filters, the details of which can be found in Key Performance Indicators, under the section Additional Filters. |
To download the print version of this article, click the PDF icon: