Cargoo Support
Dashboard version 1.5 - New design
Date: June 26, 2024
Overview
We are pleased to present the release of the Dashboard version 1.5, introducing a refreshed look and enhanced functionality. This update aims to improve your experience through strategic changes to the color, dynamic widget adjustments and more effective data representation.
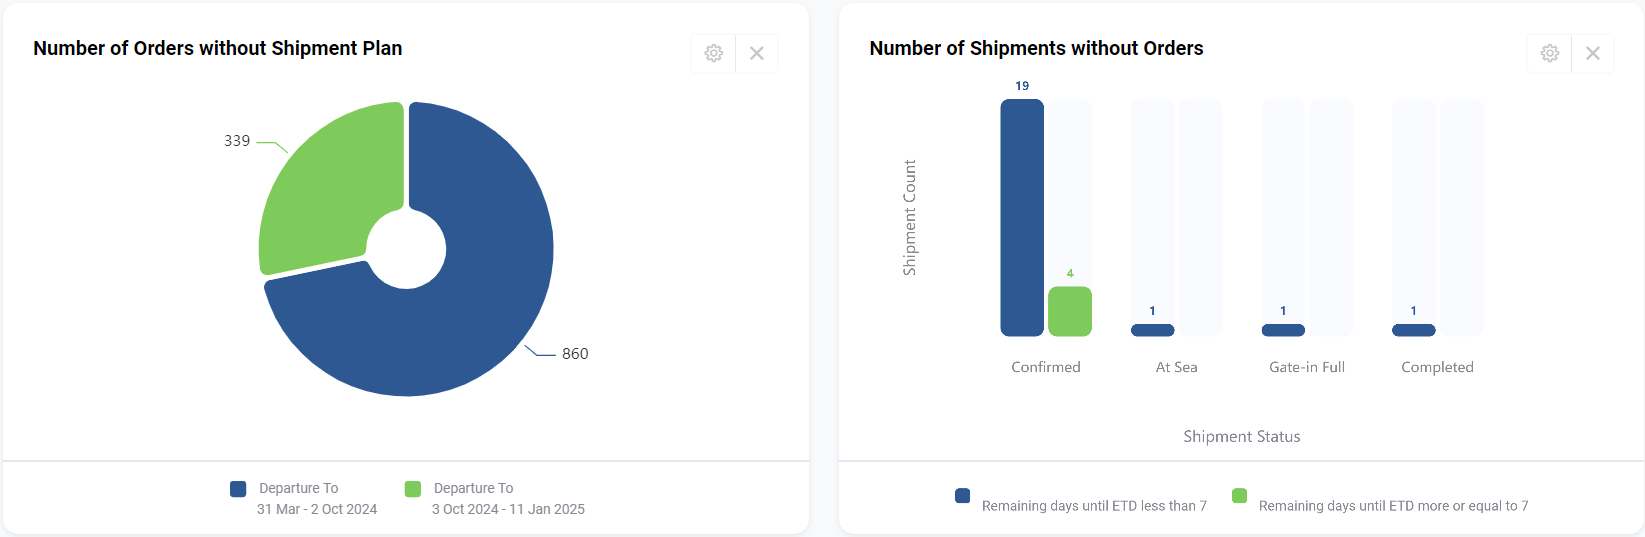
The blue segment replaces the previous red indicator, while the green segment substitutes the yellow one.
The blue segment represents priority items, whereas the green segment signifies less urgent ones.
----------------------------------------------------------------------------------------------------------------
Key highlights
Data filtering
Each widget is configured by default to display only relevant data from past three months, ensuring the content is always up-to-date. Additionally, the data filters for each widget can be manually adjusted for customized views.
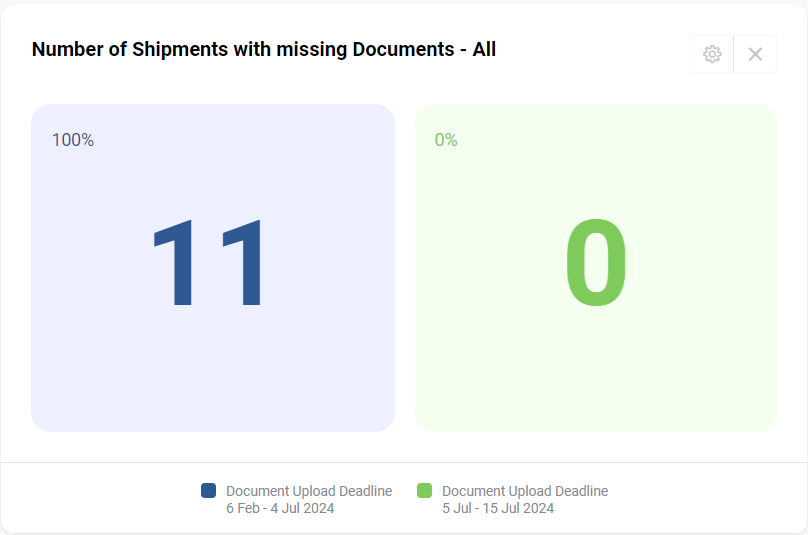
Data presented as Pie Charts or KPI Cards
The following widgets have been visually refreshed while all underlying data remains unchanged.
- Number of Orders without Shipment Plan
- Number of Shipment Plans to be Booked
- Number of Shipments with missing Documents - Own Responsibility
- Number of Shipments with missing Documents - All
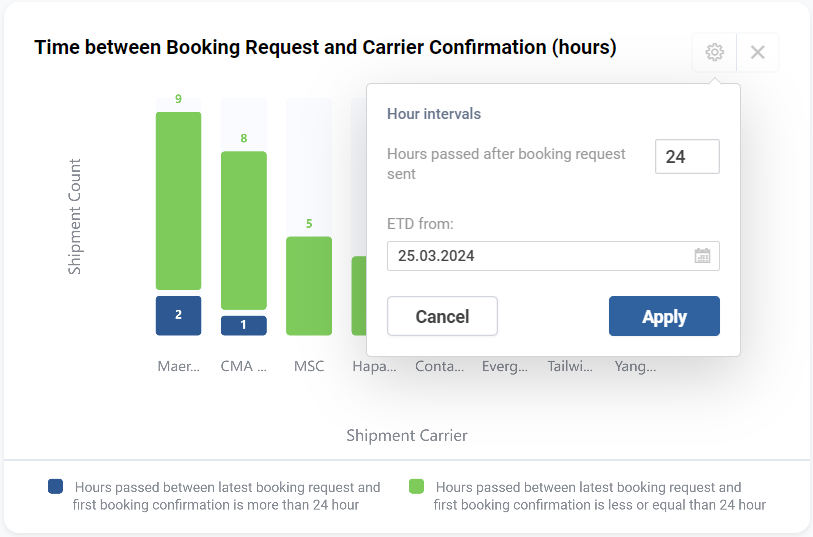
Data presented as Column / Bar chart with an additional dimension
The bar chart includes an added dimension, dividing each bar into blue and green segments. It reveals details that were previously left unexplored such as identifying the port with the highest number of idle containers or determining which shipping company has the most last-minute bookings.
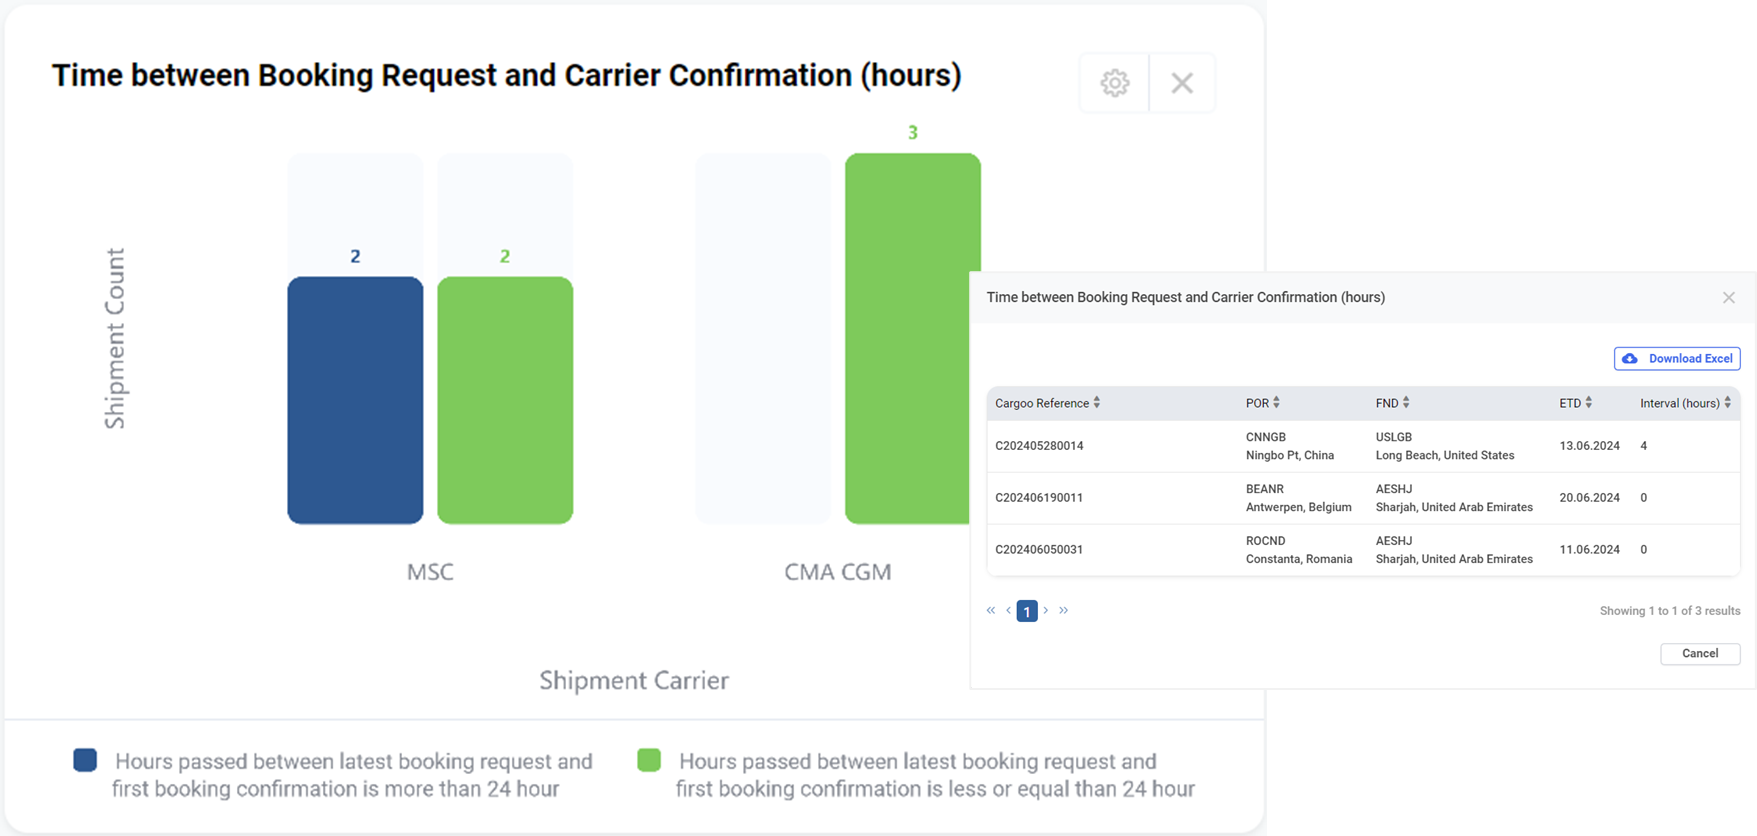
Additional dimensions in widgets
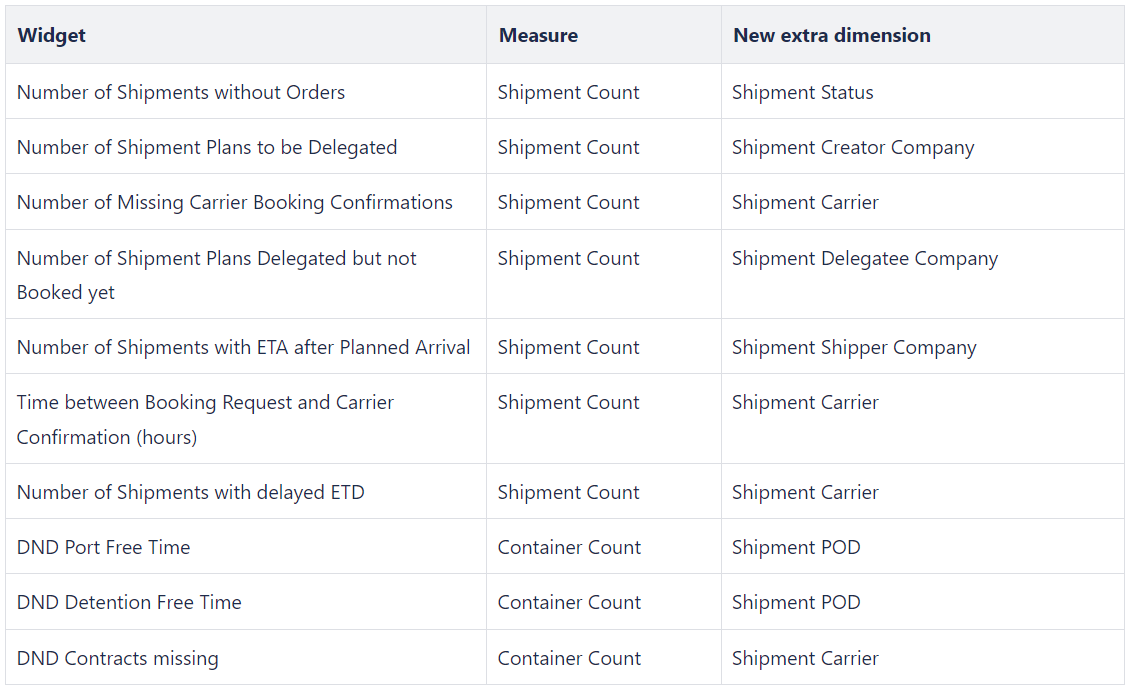
The following table provides details on the additional dimensions utilized in the widgets: