 BIM Support
Common Features: Report Table
Once all the filters are set, you can generate a report by clicking the Generate Report button.
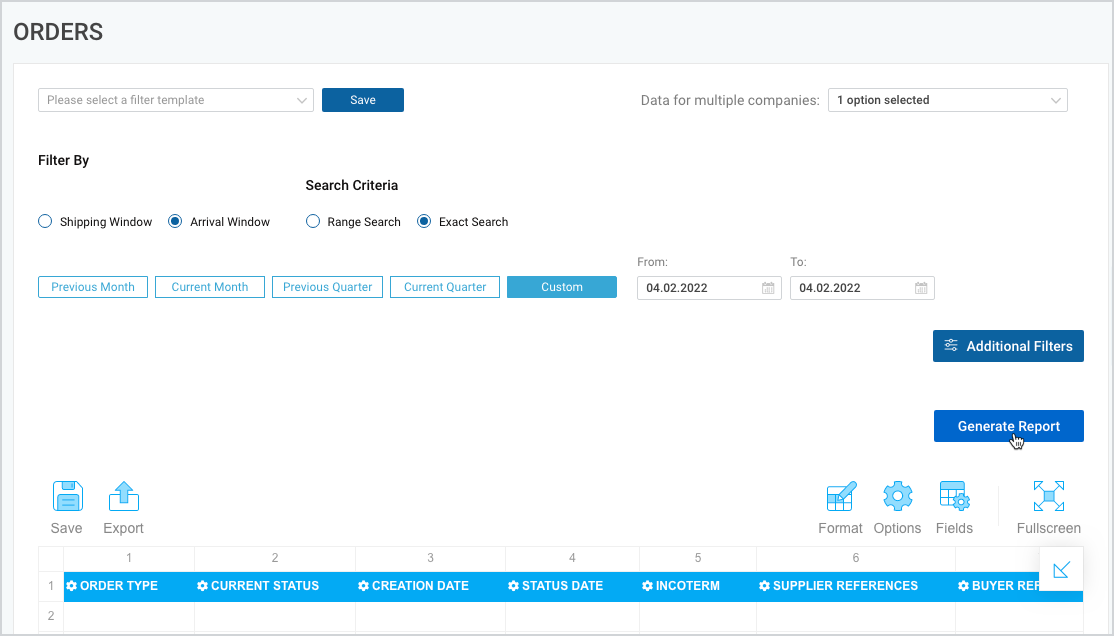
Figure 1
You can use the offered report features to
- View the report in a full-screen mode;
- Format cells and apply conditional formatting;
- Change the table layout;
- Select and arrange fields (table columns) and add new fields with calculated values;
- Download the report for further thorough analysis.
Note | Flexmonster is embedded into Cargoo for data visualization purposes. This article aims to help you get acquainted with the interface and set the basic preferences. |
Note | All report categories along with their special features are described in separate articles. For detailed information please check the respective articles. |
View the Generated Report in Full-Screen Mode
To view the report in full-screen mode
- Click the Full-screen icon.
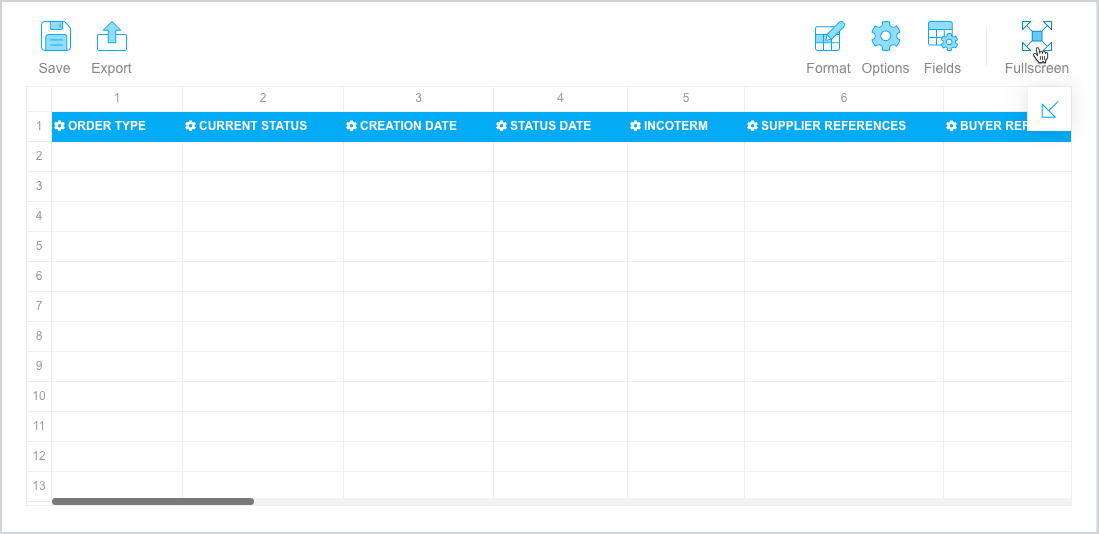
Figure 2
Format Cells
To format cells
- Select Format>Format cells.
- On the pop-up window, from CHOOSE VALUE drop-down list select the columns you want to format.
You can select multiple columns if you want them to share the same formatting settings. - Click Apply/Cancel to confirm or cancel the changes.
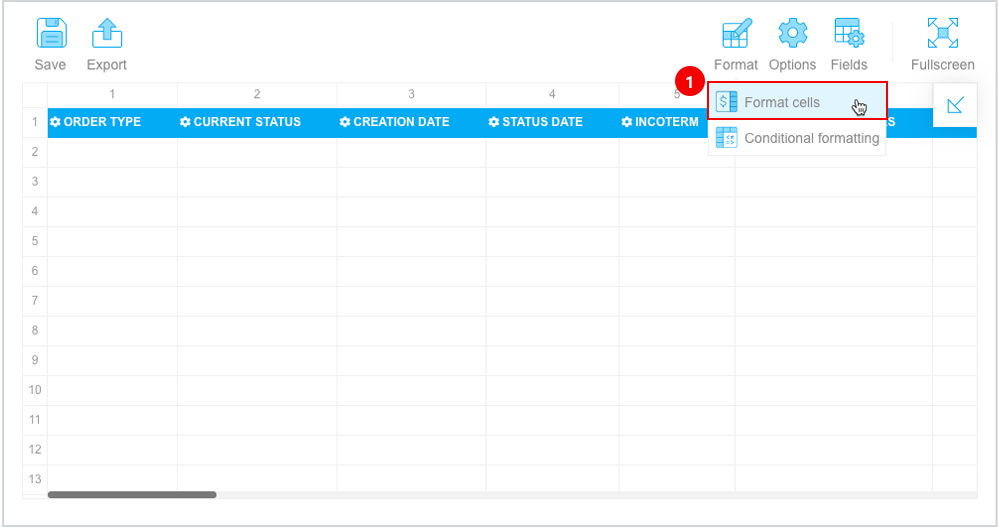
Figure 3
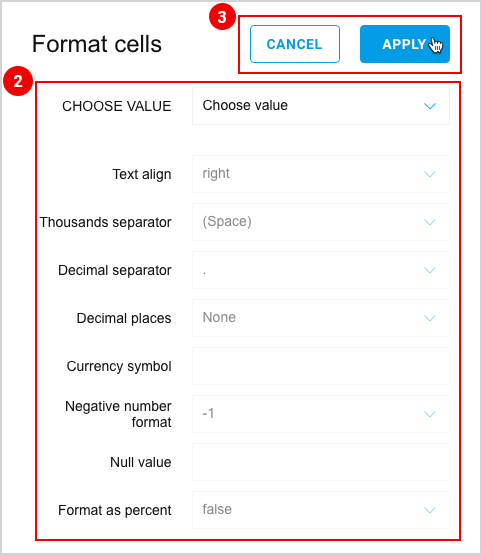
Figure 4
Apply Conditional Formatting
To apply conditional formatting
- Select Format>Conditional formatting.
- Select the + icon or + Add condition.
- Set the desired condition for numeric values.
- Using the drop-down menus, change the font type, size, and color.
- Click Apply/Cancel to confirm or cancel the changes.
Note | Value formatting is only applicable to numeric values, yet font formatting is applicable to all value types. |
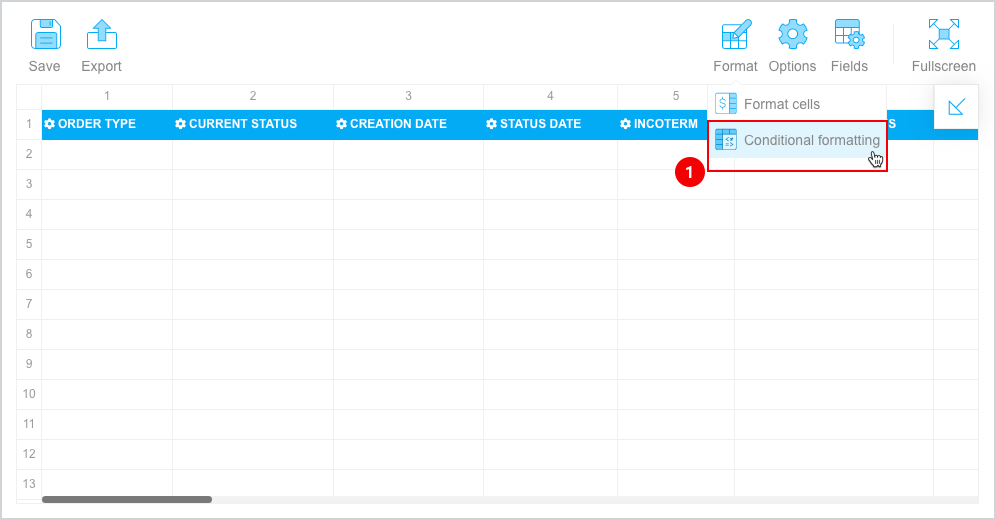
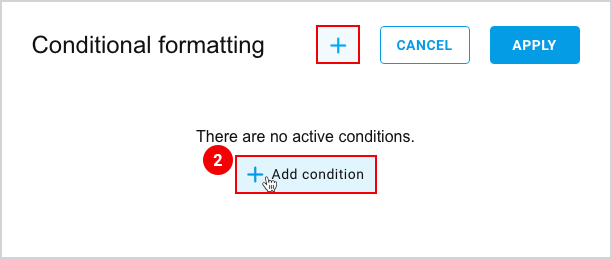
Figure 6
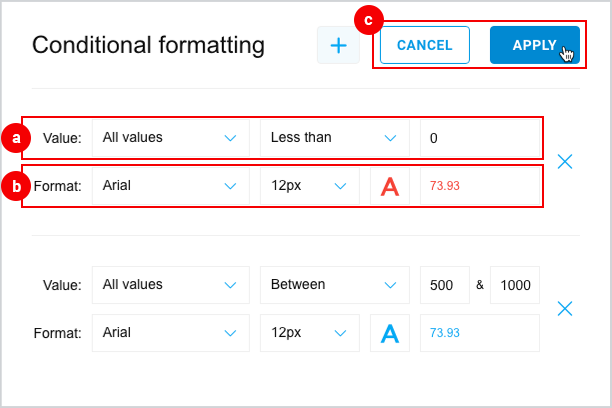
Figure 7
Change Table Layout
To change table layout
- Select the Options icon.
- Choose the desired layout format and set the preferences for GRAND TOTALS and SUBTOTALS.
- Click Apply/Cancel to confirm or cancel the changes.
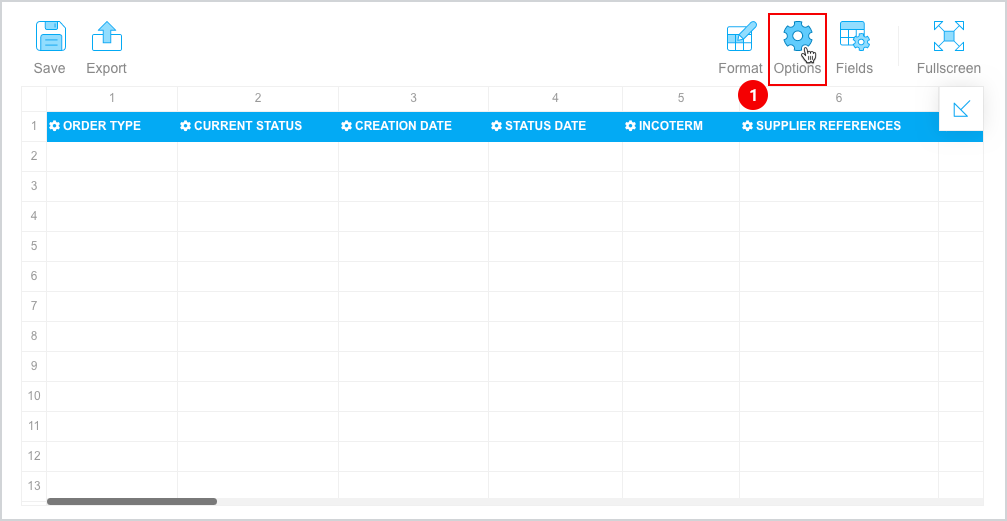
Figure 8
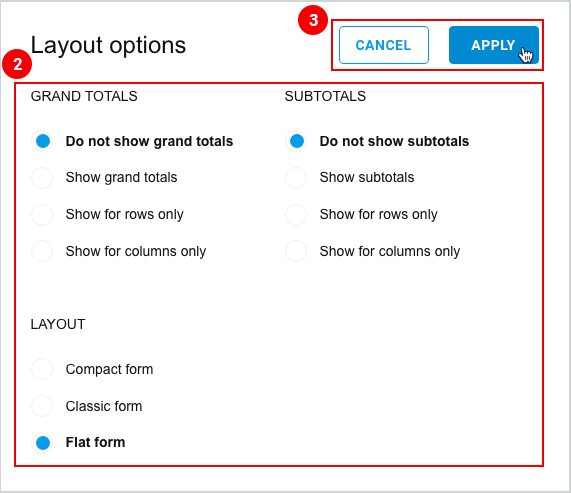
Figure 9
Arrange Fields (Table Columns) and Add Calculated Fields
Select the fields you want to be included in the generated table or add new calculated fields.
- Select Fields.
- Choose the fields you want to be included in the generated report and select Add Calculated Field to add a new field.
- In the Value Name field type in a new field name and select the formula you want to add.
- Modify the formula using the Select Aggregation drop-down menu on the right side of the chosen option.
- Drag and drop the chosen option to the formula section. Use the provided operators and functions to modify the formula or add more complex formulas.
- To calculate only individual values, select Calculate individual values.
- Click Apply/Cancel to confirm or cancel the changes.
Note | By default, all fields are selected. Ignore steps 3-6, if you don’t want to add new calculated fields |
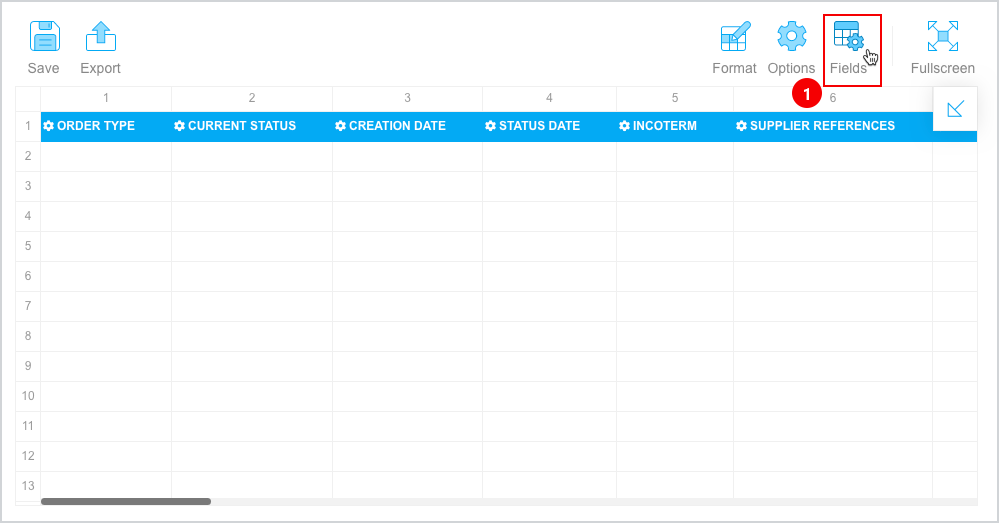
Figure 10
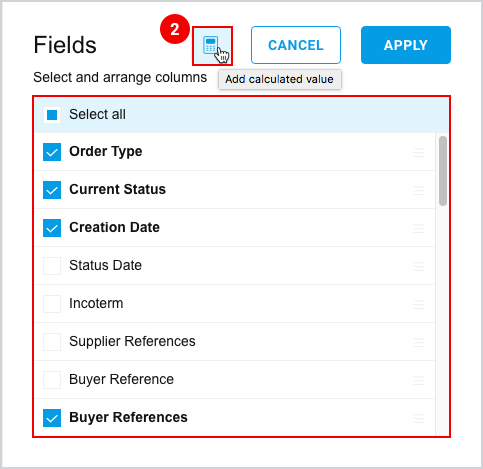
Figure 11
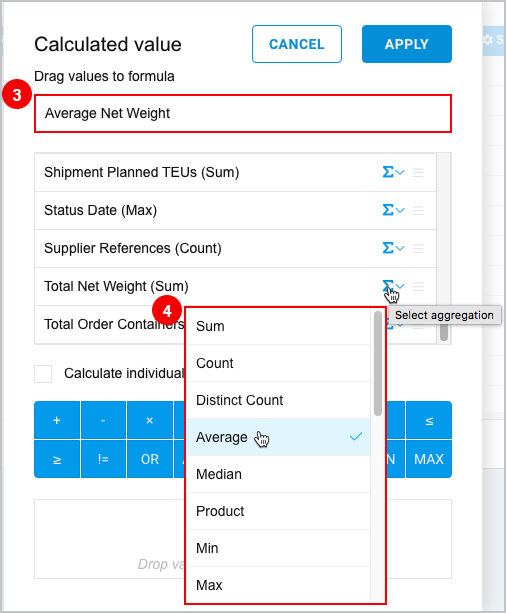 | 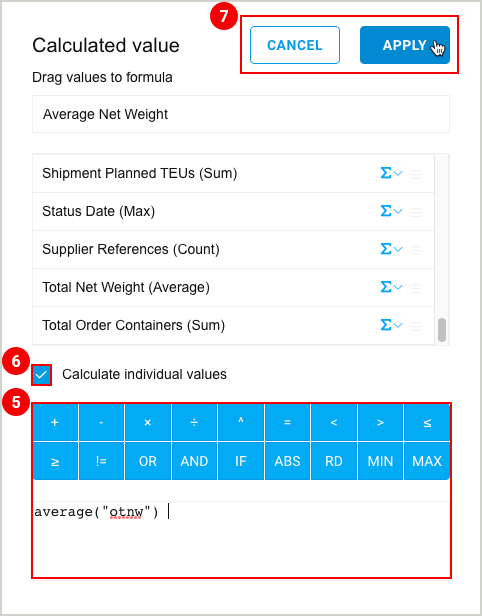 |
Figure 12
Save and Export the Report
With this feature you can
- Save the report as a JSON file.
- Print the report or export it to the following file formats:
- HTML
- CSV
- Excel
- Image
Save the Report as a JSON File
- Click the Save icon.
- On the dialogue box, select Save to proceed, or else click Cancel.
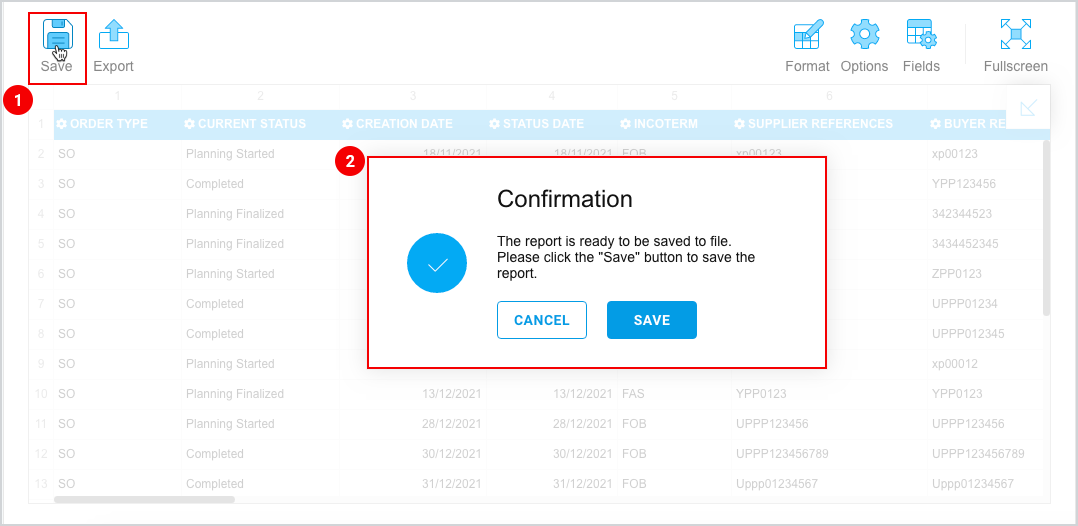
Figure 13
Print the Report
- Select Export>Print.
- Select a destination and click Print to print it. To cancel the process click Cancel.
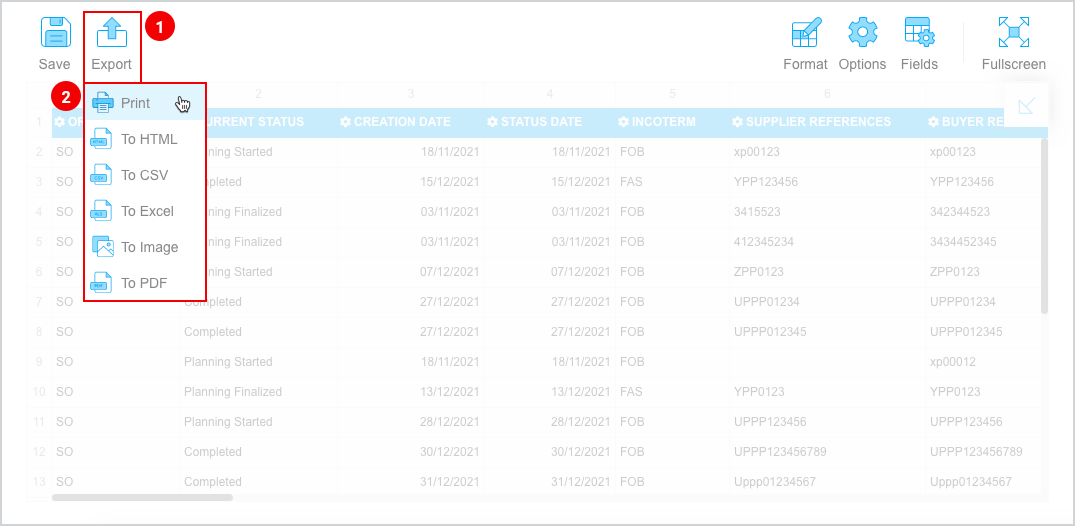
Figure 14
Export the Report to a Format You Need
- Select Export.
- From the drop-down list choose the format you want to save the report to.
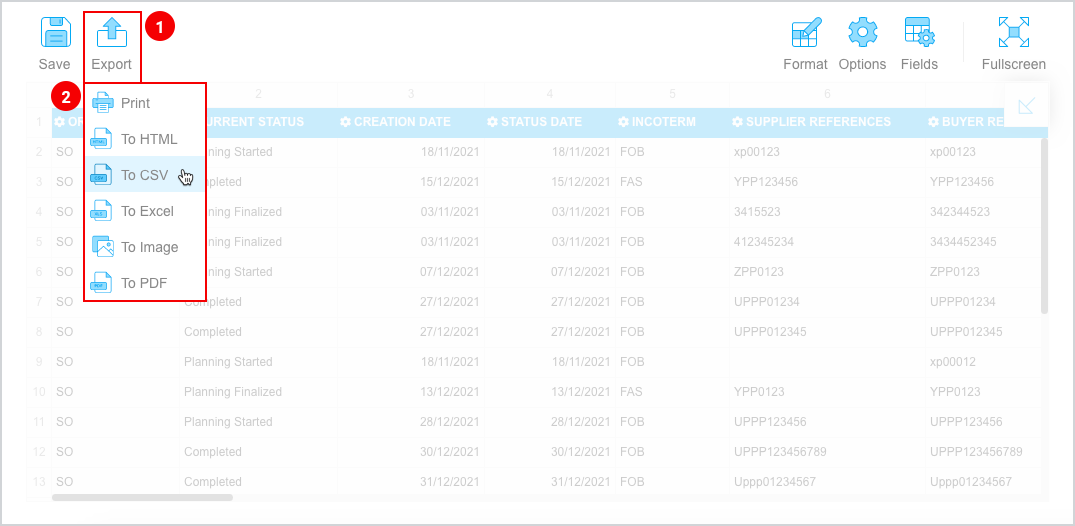
Figure 15
To download the print version of this article click the PDF icon: